ChartCreate
A friendly interface for Apache ECharts
Apache ECharts is one of those projects I keep coming back to. It strikes a good balance between control and ease of use—powerful enough for complex visualizations, simple enough to get something working quickly.
I wanted to build a frontend where people could create charts visually and export them as PNG or JPG without writing code. ChartCreate does that. You can also render charts in XKCD style or with a hand-drawn look using rough.js.
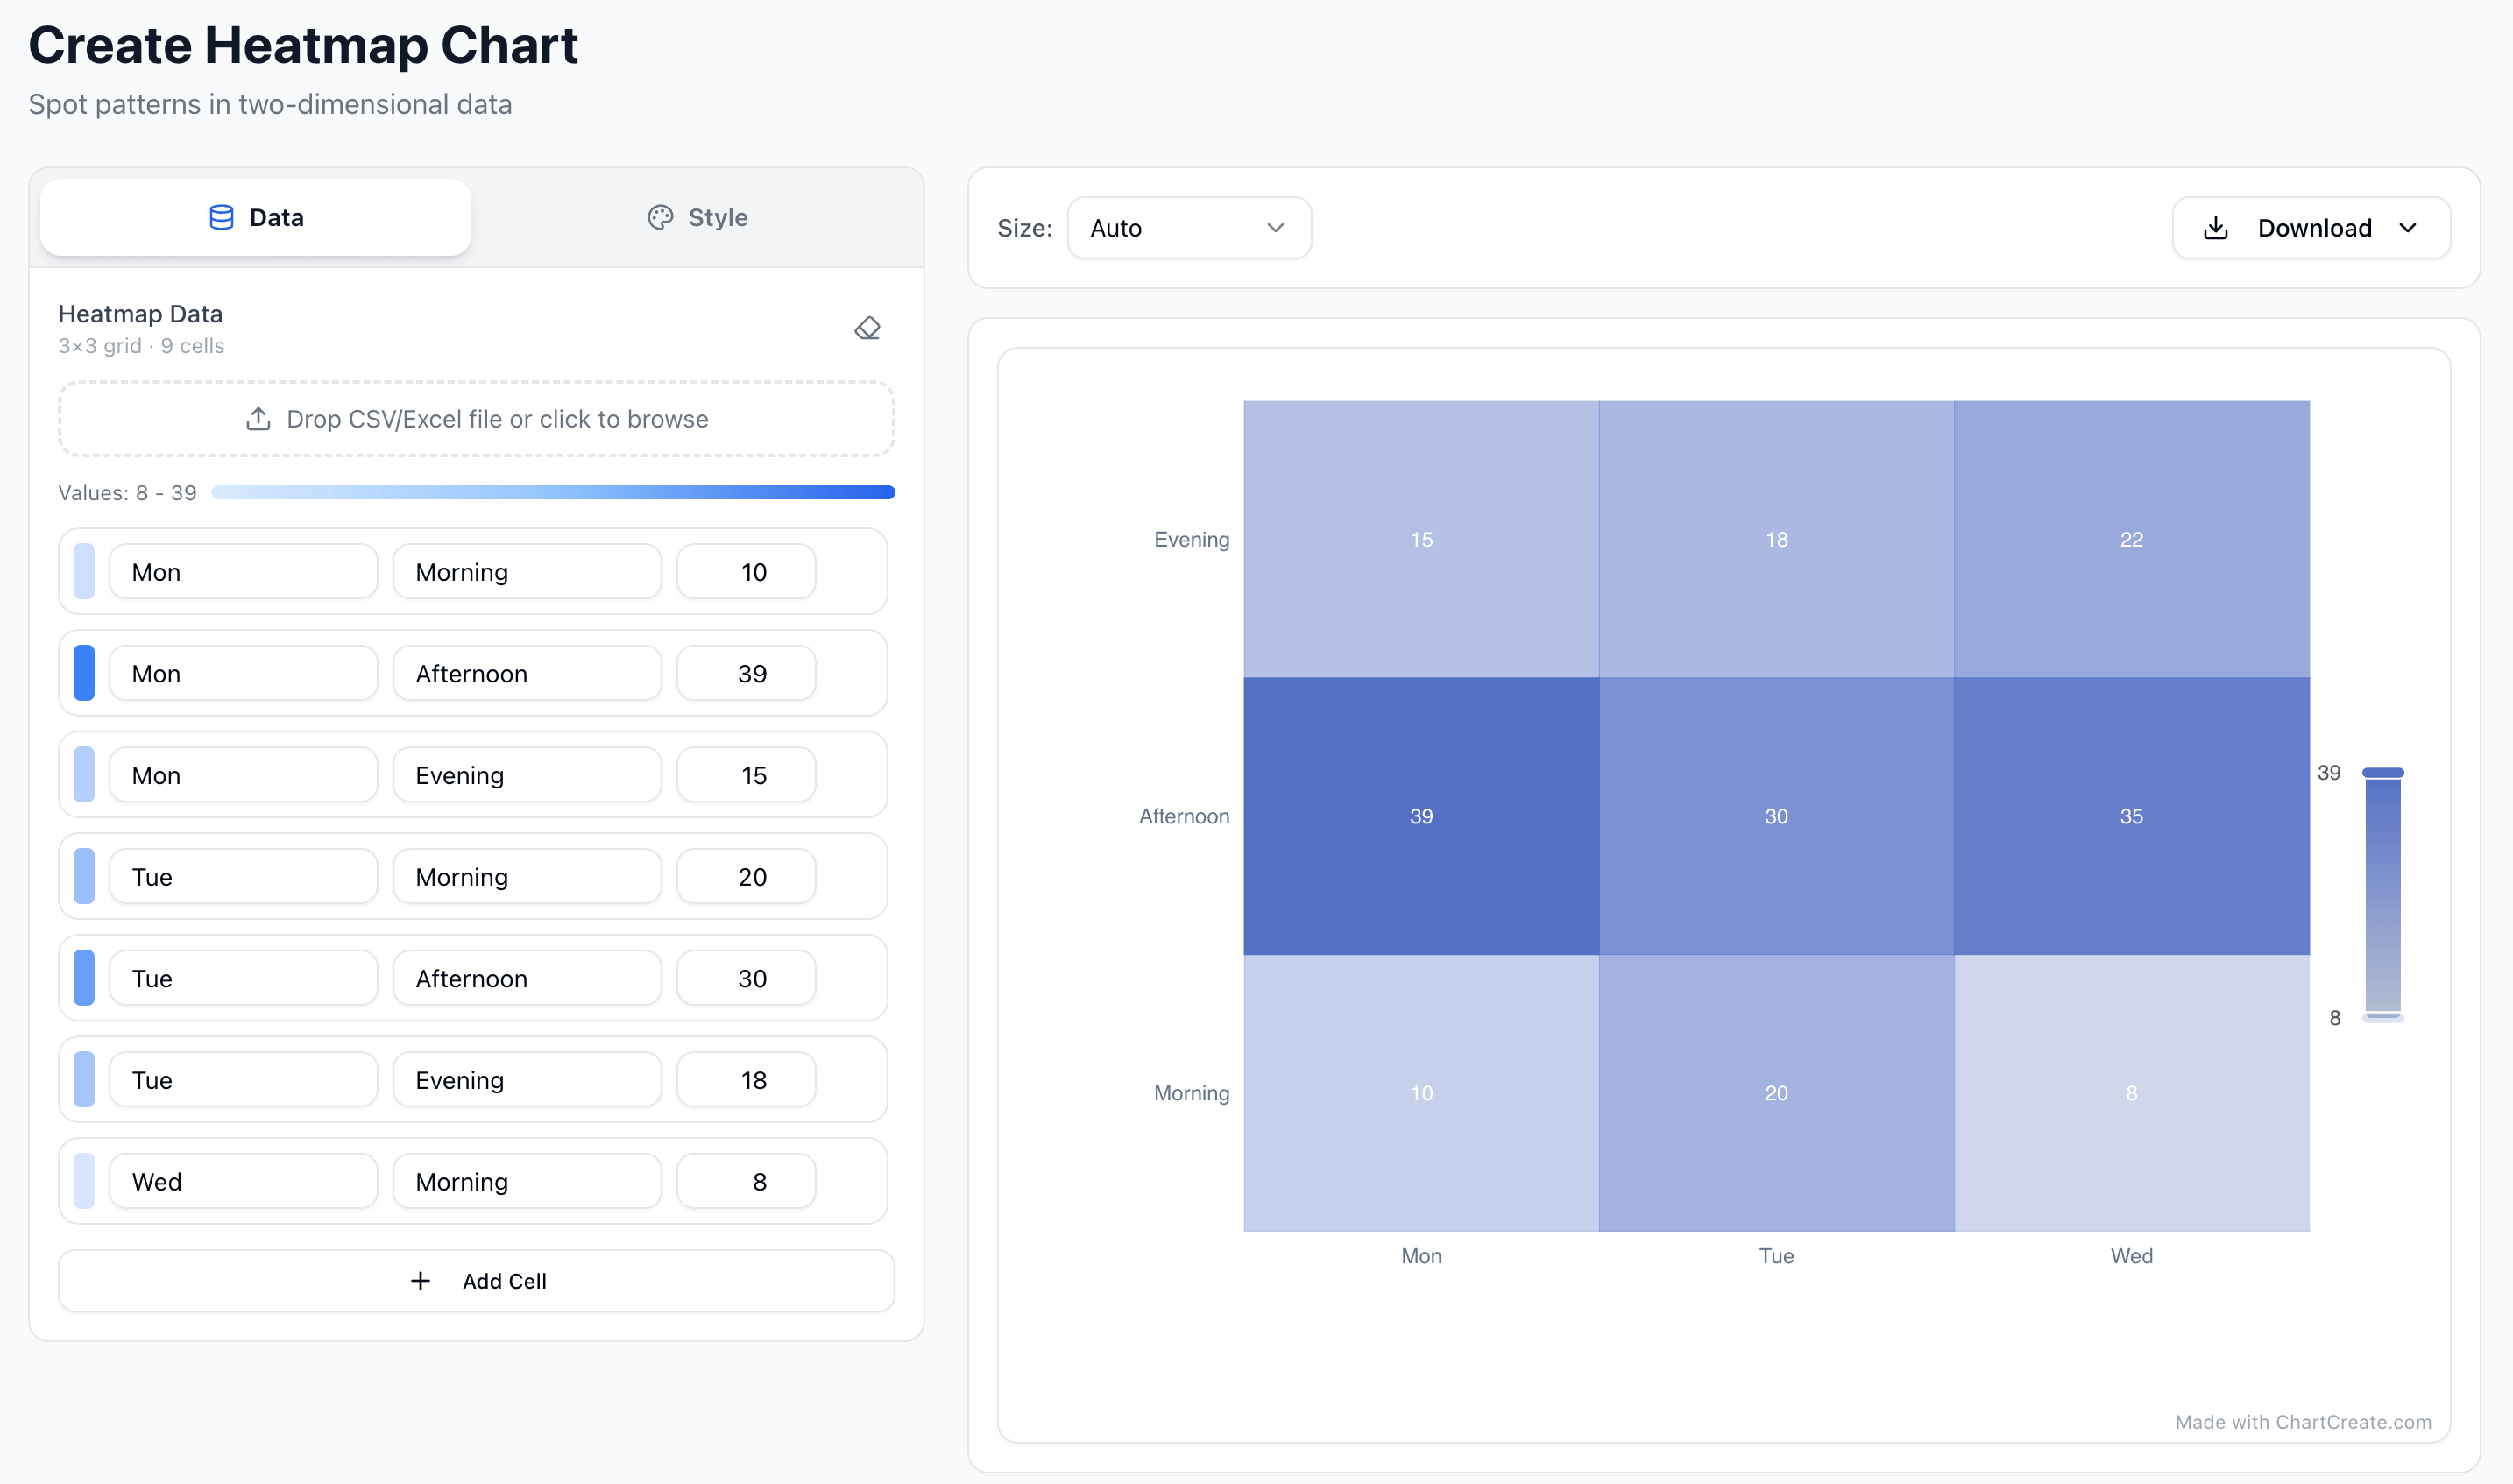
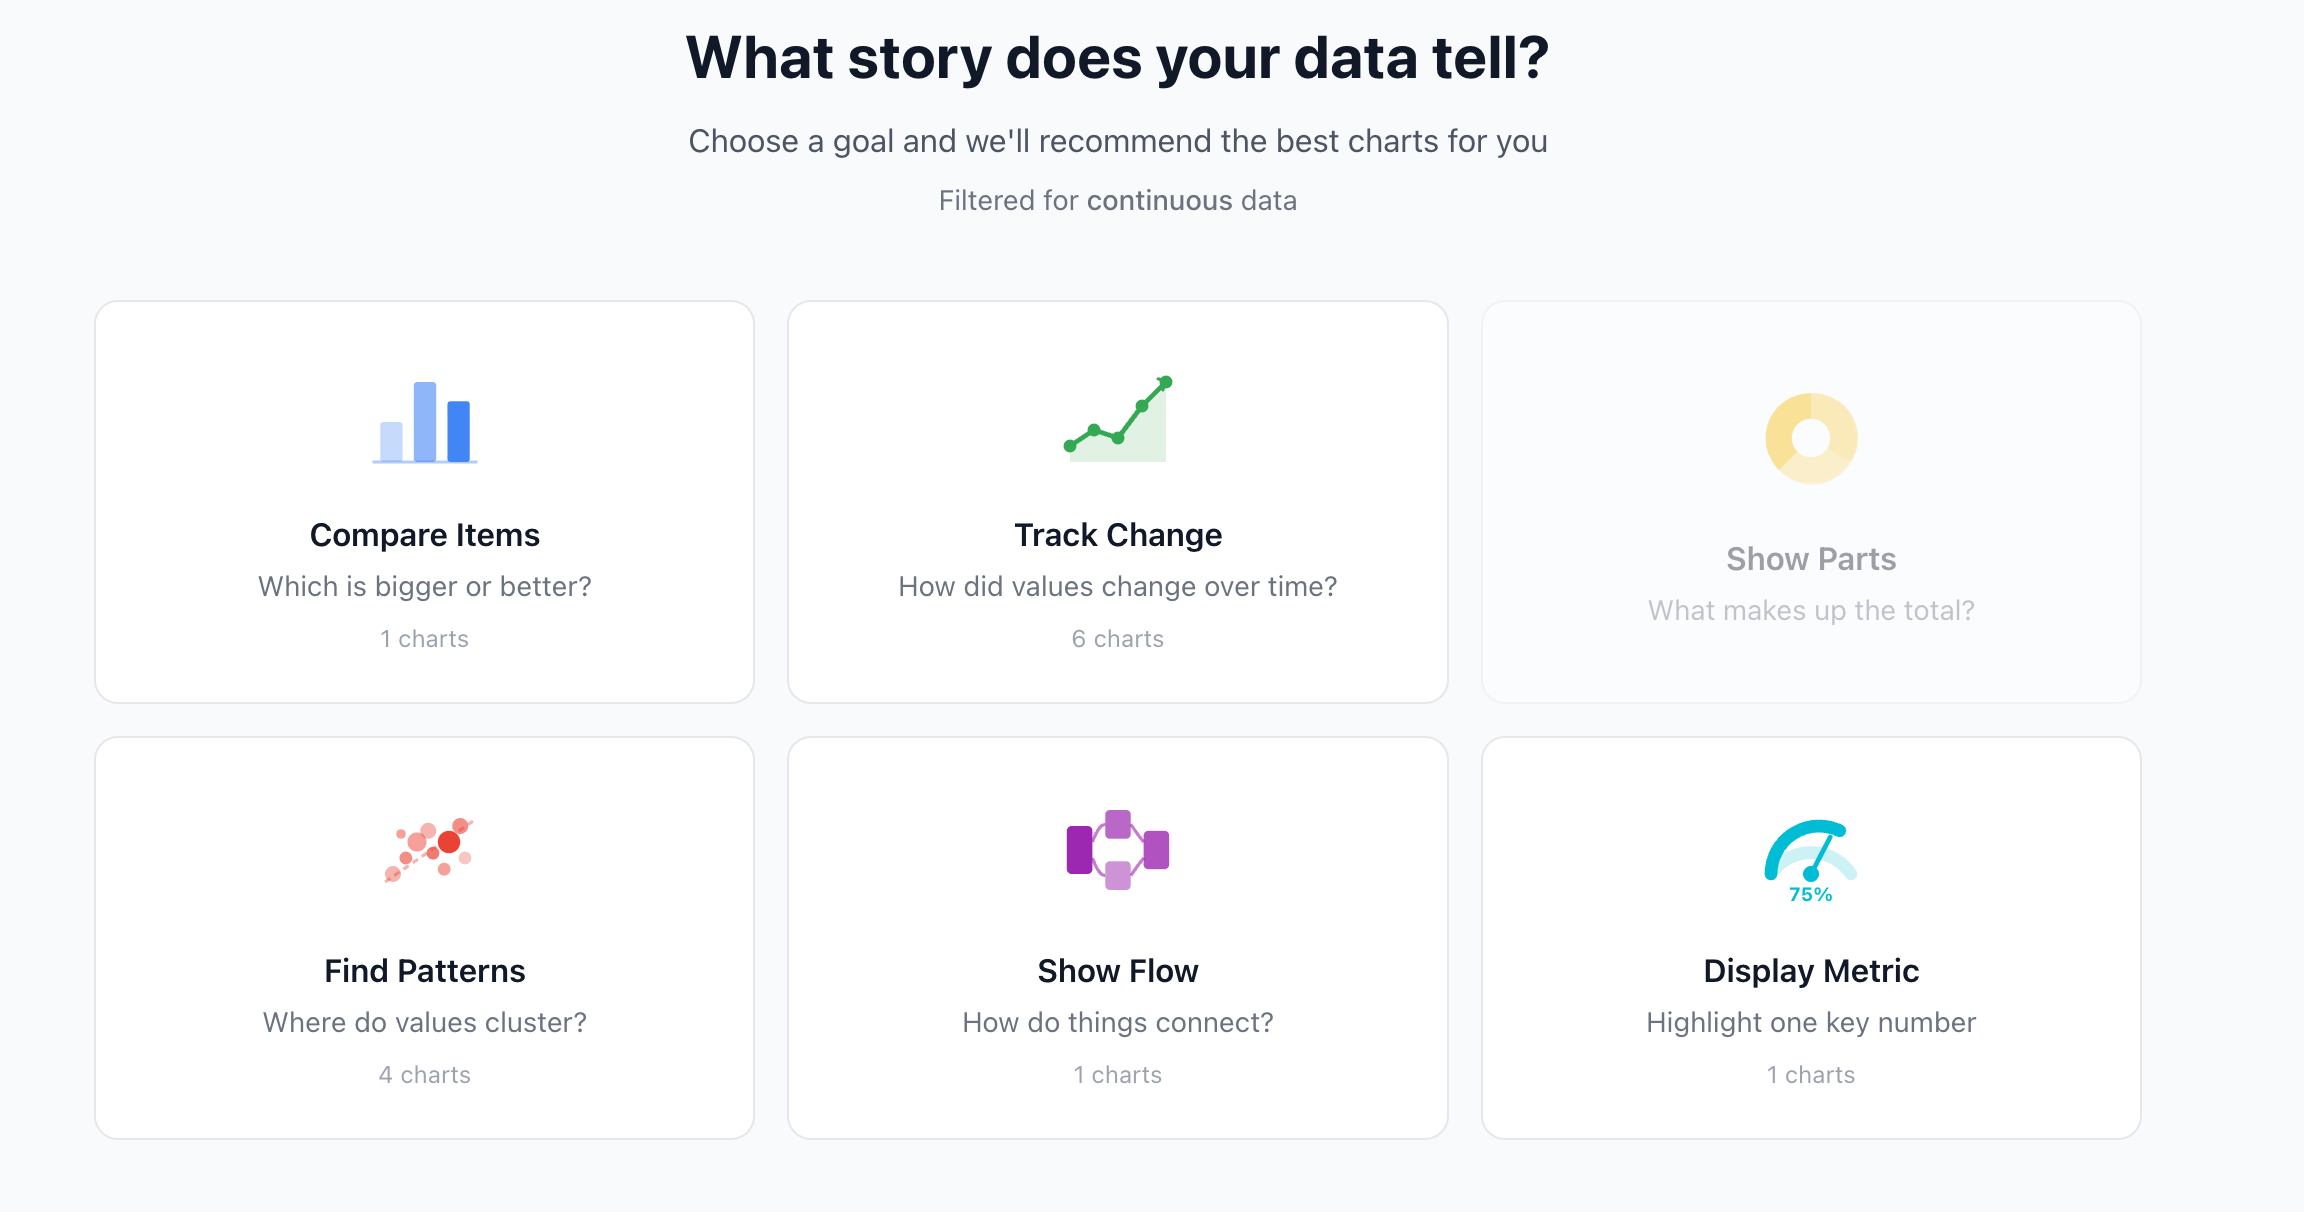
Choosing the right chart for your data isn’t obvious. Bar chart? Line chart? Heatmap? I added a wizard that asks what you’re trying to show, whether that’s comparing items, tracking change over time, or finding patterns, and recommends the best chart type for the job.
Try it at chartcreate.com.